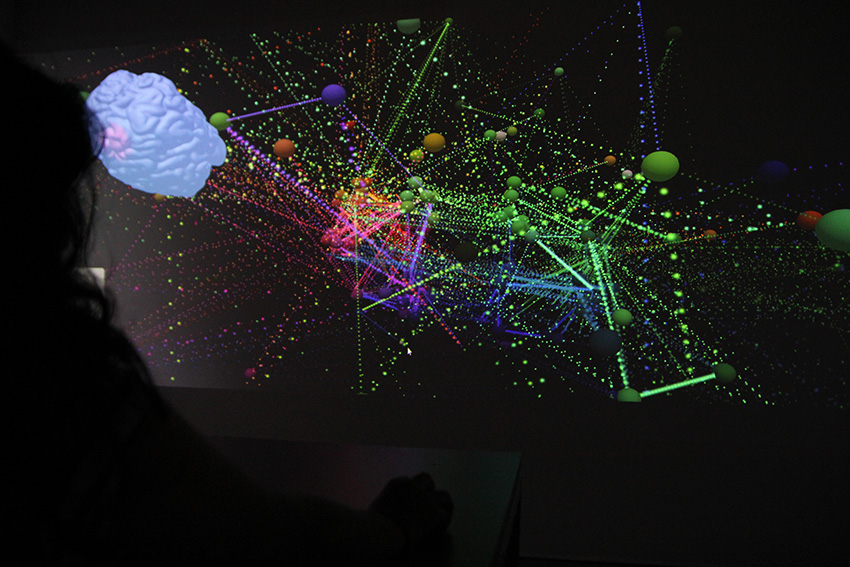
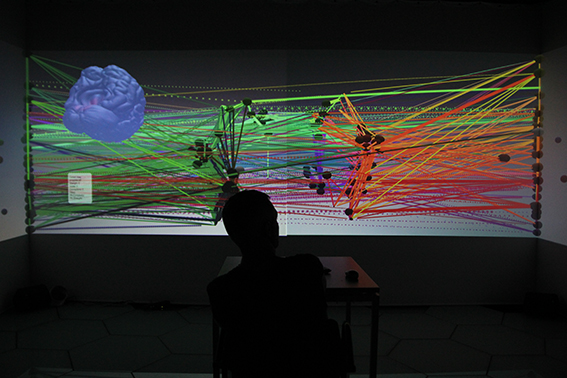
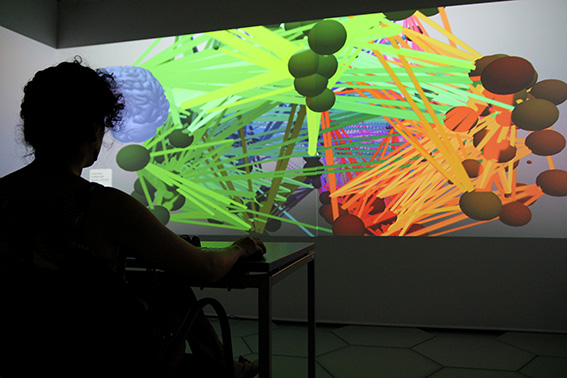
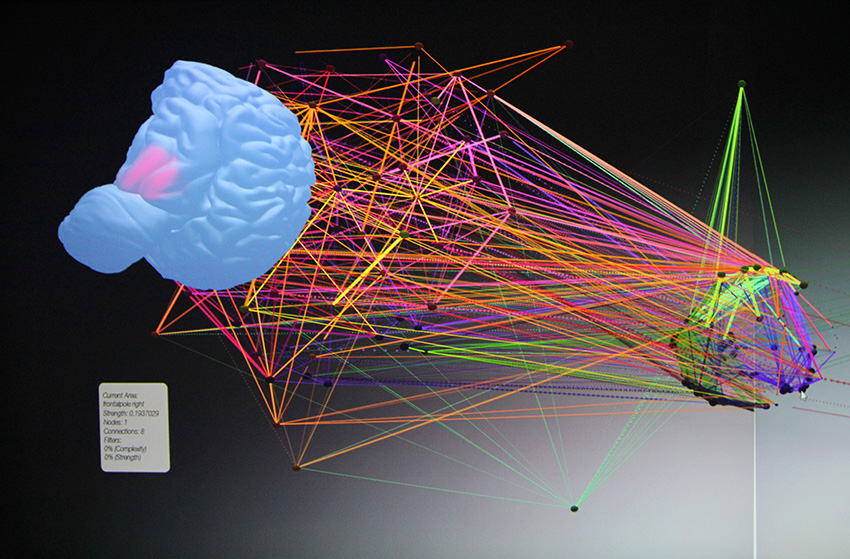
Brain connectivity as well as another network systems have been visually investigated using the known symbols of graph theory. The widely spread node-edge method, has marked a tendency into the scope of network representations in different research fields.
This project is part of a study that builds up a theoretical-grounded analysis by taking concepts from different points of view and introduce a novel aesthetical approach to visualize and explore complex data sets.
These images show a neuronal data set which represents a bank of information stillunknown, in process to be understood and, for this reason, in – visible to the human gaze.
Visualización de sets de datos neuronales / Neuronal Data Visualization
Visualización interactiva desarrollada con Unity 3d y presentada en un entorno de realidad mixta.
Interactive visualization developed with Unity 3d and shown in a mixed reality environment
2012
* Neuroscience Application developed at SPECS, Universidad Pompeu Fabra, Barcelona, Spain
Supervisor Alberto Betella.
